Мониторинг лог файлов в Windows
не плохая статья
http://nagios.fm4dd.com/howto/monitor-custom-windows-logfiles.htm
Introduction
Monitoring custom application log files with Nagios is quite a complex task, it deserves a tutorial of its own. I believe there is no turnkey solution and to solve it we need to break the requirement up into functional parts to combine existing software.
In this particular example, I will look at building the Windows log monitoring from the following 3 software components:
- check_logfiles from ConSol Labs for actually parsing the log
- NSClient++ written by Michael Medin for kicking off the log parser
- check_nrpe written by Ethan Galstad for making the remote call from Nagios
Design
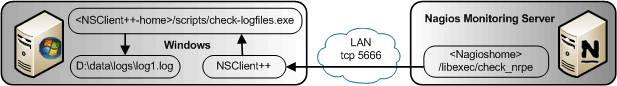
Part 1: Custom log parsing under Windows based on Error and Warn criteria, generating Nagios compatible output
The check_logfiles plugin is needed to parse the log based on freely defined patterns and return a Nagios readable status. It is available as an executable for Windows and integrates with NSclient++. Simply place it in a good home on your Windows server. Either in a directory by itself, or another good place is to place it later into the scripts directory of the NSClient++ home. Next, we create a log parsing configuration file, here I named it check_logfiles.cfg. We set our example log file to be in D:\data\logs\log1.log, and we define example warning and critical strings to search for.
$MACROS = { LOGDIR => 'D:\data' };
@searches = ({
  tag => 'apperror',
  logfile => '$LOGDIR$\logs\log1.log',
  criticalpatterns => [
      'ERROR timestamp appfailure 1',
      'ERROR timestamp appfailure 2' ],
  warningpatterns => [
      'WARN timestamp appwarning 1',
      'WARN timestamp appwarning 2' ]
});
Next, we run the check_logfiles.exe on the Windows system over our example logfile to test the configuration we just created. In the example below, I inserted a test string into the log file to see if the critical pattern filter matches.
C:\logmonitor> check_logfiles.exe -f check_logfiles.cfg
CRITICAL - (1 errors in check_logfiles.protocol-2011-06-17-15-02-37) - ERROR timestamp appfailure 1 caused by xxx
|apperror_lines=2 apperror_warnings=0 apperror_criticals=1 apperror_unknowns=0
Part 2: Initiating the log check and transporting the result back to Nagios
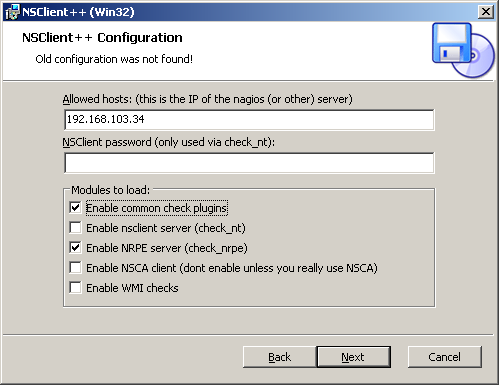
Next comes the NSClient++, which is a free monitoring agent written for Windows (32 and 64bit). It collects various standard performance data, and in addition it can call external scripts for custom monitoring such as our check_logfiles.exe plugin. During the installation of NSClient++ we should enable the NRPE server module to listen for check_nrpe service requests. While it is possible to also call NSClient++ with the Nagios-builtin plugin ‘check_nt’, the additional plugin ‘check_nrpe’ is needed to use NSClient++ with external scripts.
After installing the NSClient++ software on the Windows system and the NRPE check plugin on the Nagios server, we test the monitoring connection from Nagios and verify network connectivity works:
susie112:/srv/app/nagios/libexec # ./check_nrpe -H 192.168.103.184
I (0.3.8.75 2010-05-27) seem to be doing fine...
Now we can build the connection between the NSClient++ agent and the check_logfiles.exe plugin on the Windows system. We need to edit the NSClient++ configuration file NSC.ini, enable the line CheckExternalScripts.dll under the [modules] section and add a line describing how we need to call our script in the [External Scripts] section:
check_logfiles=C:\logmonitor\check_logfiles.exe -f C:\logmonitor\check_logfiles.cfgAfter that we are ready to try and call the log parsing from our Nagios server with the check_nrpe plugin.
susie112:/srv/app/nagios/libexec # ./check_nrpe -H 192.168.103.184 -c check_logfiles
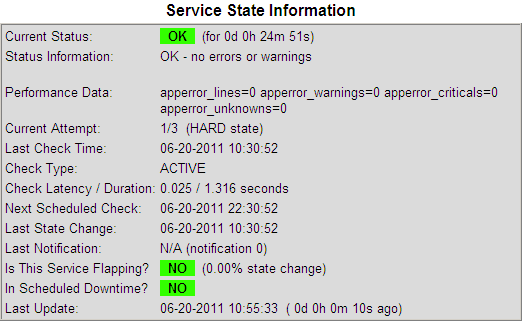
OK - no errors or warnings|apperror_lines=0 apperror_warnings=0 apperror_criticals=0 apperror_unknowns=0If this works, the only remaining task is to add the usual Nagios service configuration definitions and test it end-to-end.
Nagios Service Configuration
susie112:~ # vi /srv/app/nagios/etc/objects/command.cfg
# 'define check_nrpe'
define command{
command_name check_nrpe
command_line $USER1$/check_nrpe -H $HOSTADDRESS$ -c $ARG1$ -t 60
}
nagios@susie112:~> vi /srv/app/nagios/etc/objects/win-logfile-services.cfg
###############################################################################
# Define a servicegroup for Windows log file checks
###############################################################################
define servicegroup{
servicegroup_name win-logfile-checks ; The name of the servicegroup
alias Windows Log Checks ; Long name of the group
}
###############################################################################
# Define the generic patch check service template
###############################################################################
define service{
name generic-win-logfile
active_checks_enabled 1
passive_checks_enabled 0
parallelize_check 1
obsess_over_service 1
check_freshness 0
notifications_enabled 1
event_handler_enabled 1
process_perf_data 0
retain_status_information 1
retain_nonstatus_information 1
is_volatile 1
check_period 24x7
max_check_attempts 1
normal_check_interval 5 ; check every 5 minutes
retry_check_interval 1
contact_groups win-admins, security-team
notification_options u,w,r ; notify unknown, warn, recovery
notification_interval 1 ; ignored for volatile services
notification_period 24x7
register 0
servicegroups win-logfile-checks
}
###############################################################################
# Windows logfile checks
###############################################################################
define service {
use generic-win-logfile
host_name winserver1
service_description check_logfiles
check_command check_nrpe!check_logfiles
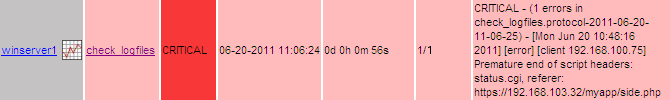
}The check_logfiles plugin resports only new alerts for each run. In order to alert for each occurence we need to set the Nagios parameter is_volatile.
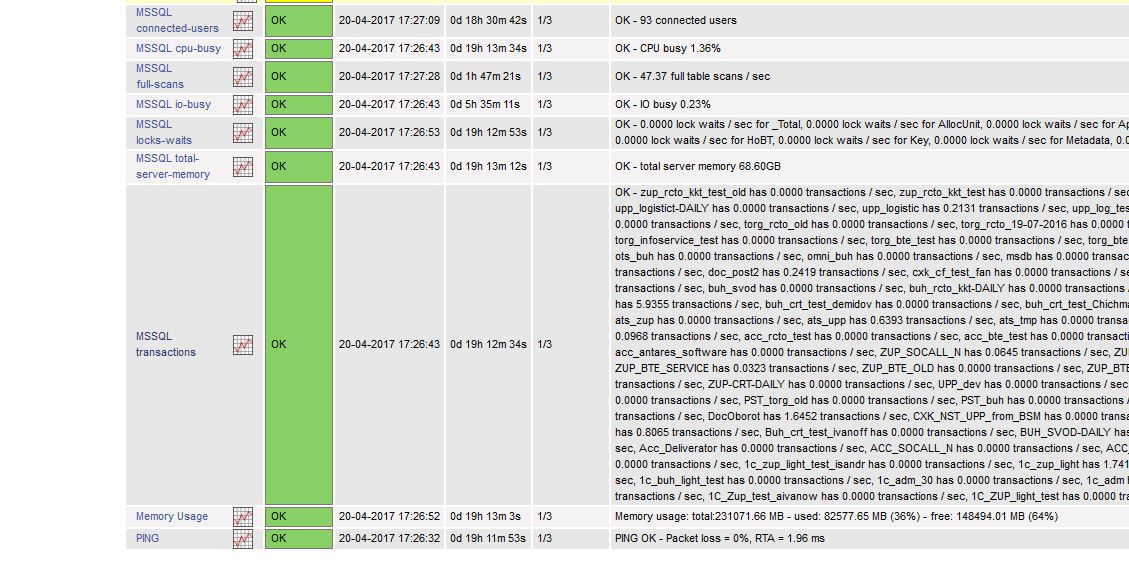
Example Screenshots

Monitoring standard performance data through NSClient++ and NRPE
I mentioned that the Windows monitoring agent NSClient++ can be used to retrieve standard performance data. For completeness, here is a quick example to show how we can get the systems CPU load, making the following call from Nagios:
susie112:/srv/app/nagios/libexec # ./check_nrpe -H 192.168.103.184 -c CheckCPU -a warn=80 crit=90 time=20m time=10s time=4
OK CPU Load ok.|'20m'=0%;80;90; '10s'=12%;80;90; '4'=0%;80;90;
If there is no data returned, please check the NSCLient++ log file and make sure to set the parameter ‘allowed_arguments=1’ in the [NRPE] section of NSC.ini.
Considering alternative solutions
Instead of implementing active monitoring, we could also opt for setting up passive monitoring by scheduling the check_logfiles plugin within Windows and returning the parse result through SNMP traps using the TrapGen program similar to our setup in the Windows Patch Update Monitoring Howto. This would save us the need to install a extra monitoring daemon on Windows. Installing additional network daemons is often a security and support concern.
There is a multitude of software out that make other combinations possible as well. For example, I found that CornerBowls Log Manager software looks promising and it is not expensive. It can do the log parsing and has the SNMP trap send function already integrated. In the end it depends on your preference, network and server envrionment which plugin and method is the best to choose.
Hope this helps in getting started!
Credits, Links and additonal information
- Nagios and the Nagios community can be found at http://www.nagios.org/
- Further Nagios documentation is available here http://nagios.fm4dd.com/docs/en/
- The check_logfiles plugin from ConSol Labs can be found here
- The NSClient++ Windows monitoring agent can be found here
- NRPE, the remote plugin execution check for Nagios can be found here

 Introduction
.jpg)